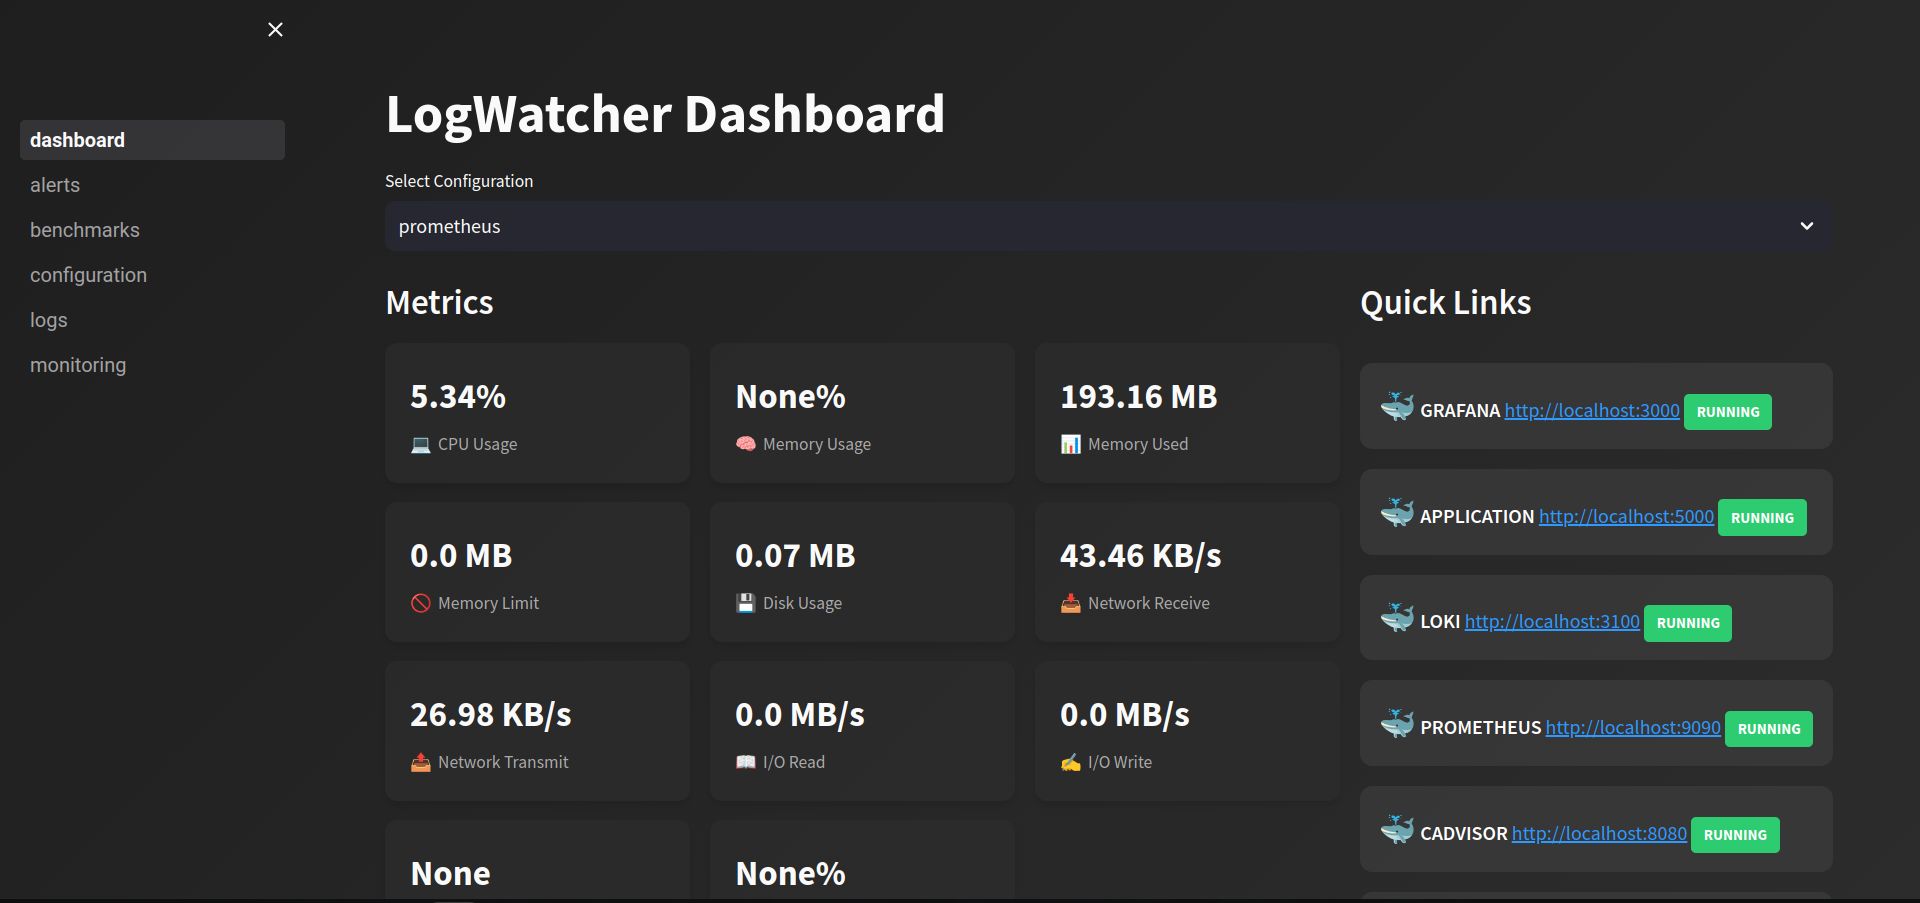
Figure 1 - LogWatcher dashboard -
Getting Started
1 - Clone the project to your local environment.
git clone https://github.com/AtakanG7/logWatcher.git
2 - Run the starter script - will check requirements and setup the environment.
sh logwatcher.sh your-docker-image-name
3 - You need to wait until the requirements installed and after a Streamlit interface will pop-up in front of you. You can start exploring through the interface.
1-1 What is LogWatcher?
Managing everything from the CLI is really easy, but GUI makes things really simple and I like simplicity. Therefore, I needed such a tool to see the metrics of my application in real time and optimize the resource usage accordingly.
Open Source Philosophy and Benefits
I believe as the open source quality increase and the time takes developers to measure twice, cut once; overall code quality will increase in the space.
One of the best ways to convey your understanding to the community by simply showing the capabilities you have. I never hide them, I think that is stupid. Nevermind!
1-2 Purpose and Benefits
This project is designed to be beneficial to developers and can be used as internal company software. The LogWatcher is beneficial when it's used to:
- Make quick and easy tests to test ready docker images.
- Get idea about total resource usage of the application.
- See error logs in real time.
- Monitor in a some period of time to see what alerts it creates.
In application monitoring the procedure needed to set-up such a system actually requires a lot of research and knowledge about configuration management.
However, since the LogWatcher abstracts away these details and automatically comes with configured monitoring tools (which will be discussed later), there is no need to manually configure and setup the exporters or scrapers.
Overall, when it's needed to get quick results about your ready docker images; this tool is a life saver for such scenarios.
2-1 LogWatcher Architecture
LogWatcher system is a micro-service architecture. Each service independent than other, connects when it's needed and each service has different responsibilities.
Since the services loosely coupled, each service can scale and change its capacity when it's required. This is a typical architecture for monitoring solutions, and there can be added more exporters to gather information about the network and its devices.
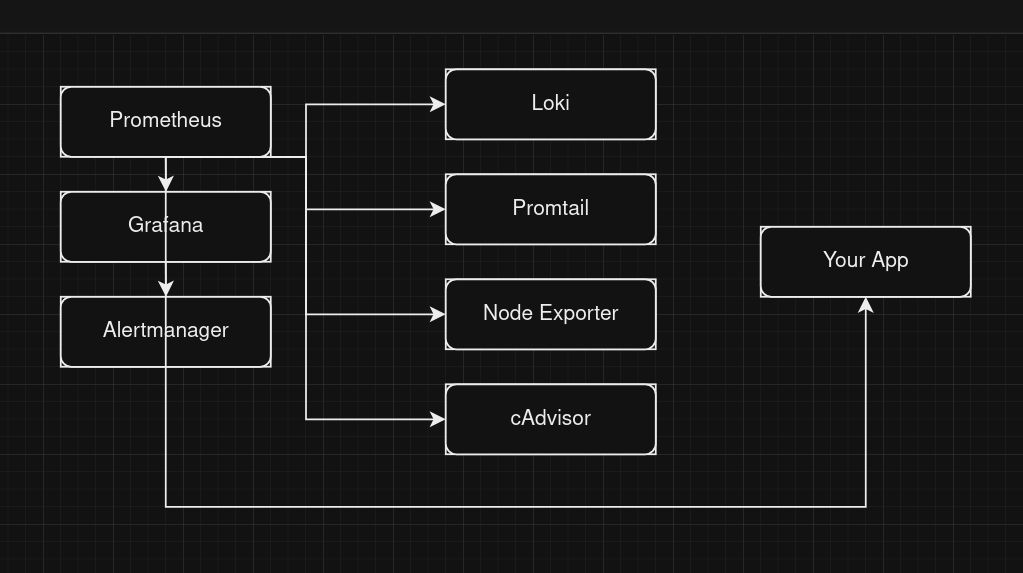
Figure 2 - Showcasing the LogWatcher system Architecture -
The whole system is in the same simple docker network interface and communicates through the docker network interfaces over HTTP/HTTPS protocol.
2-2 Technology
In this section, the majority of the technology stack will be discussed. However the GUI will be discussed now.
The architecture depicts a typical system design for monitoring, and with this design it's easy to monitor any application nodes without any additional services. However, in this project main point is to create a user interface to get insight about a docker image immediately. No configuration needed.
For this reason, I choose a python module called Streamlit for its simplicity and easy of creating such interfaces. Highly abstract modules enable fast interface creation and fast coding.
Prometheus
Prometheus is an open source metric scraper used to collect information from the registered target network devices. Its fast information processing and query capabilities make it unique.
Grafana
Granafa is also an open source tool, and provides a very unique and variety of graphical interfaces on web browser using Prometheus data. Easy to use and easy to integrate with other solutions.
Alert Manager
Alert manager is an open source tool for listening alerts from Prometheus to take actions. These actions can be listed as email, telegram, discord, slack... and so on.
Loki & Promtail
Loki and Promtail stack is used to collect log information from the target container applications. The collected data pipelines into Prometheus for later access.
Node Exporter & Cadvisor
Node exporter and Cadvisor are solutions to collect information about the local system and the docker containers.
3-1 LogWatcher Features
Important features can be listed as:
- Monitoring
- Alert System
- Benchmarking
- Configuration Management
- Real-time Logs
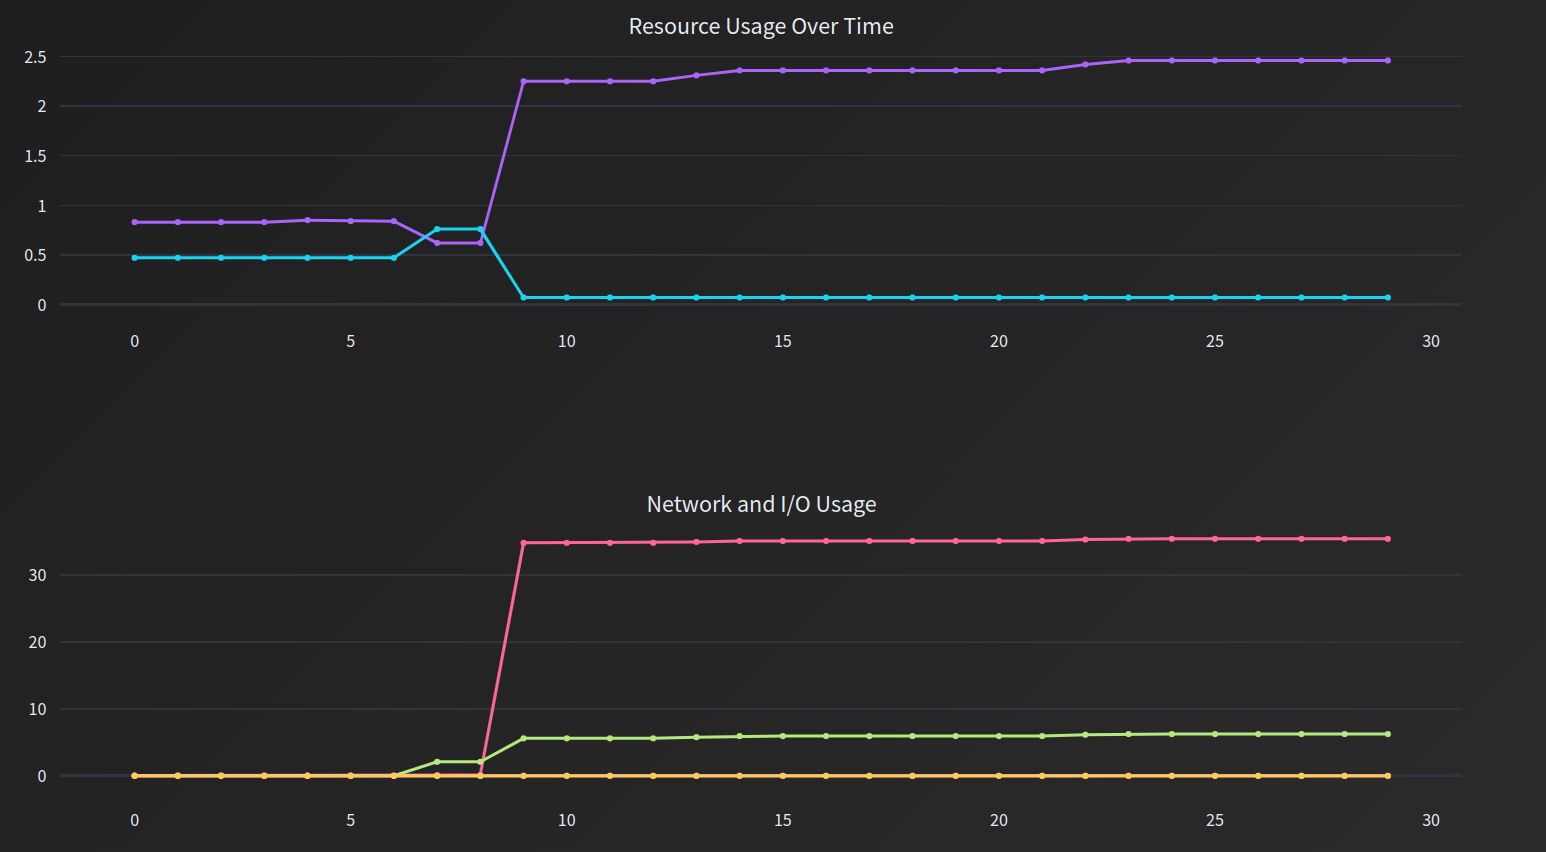
Figure 3 - LogWatcher monitoring center illustrated -
Monitoring
LogWatcher utilized mentioned technologies to gather information about the network and its devices. This enables it to create visually appealing dashboards and monitoring systems.
Alert System
Alert system listens for any events from Prometheus and in case of any problem it takes immediate action and sends message to technical person.
Benchmarking
Benchmarking is another feature that makes this tool stand out. I believe testing on the fly is stressful for developers (I know). Knowing the results before deployment is crucial for career growth ha ha.
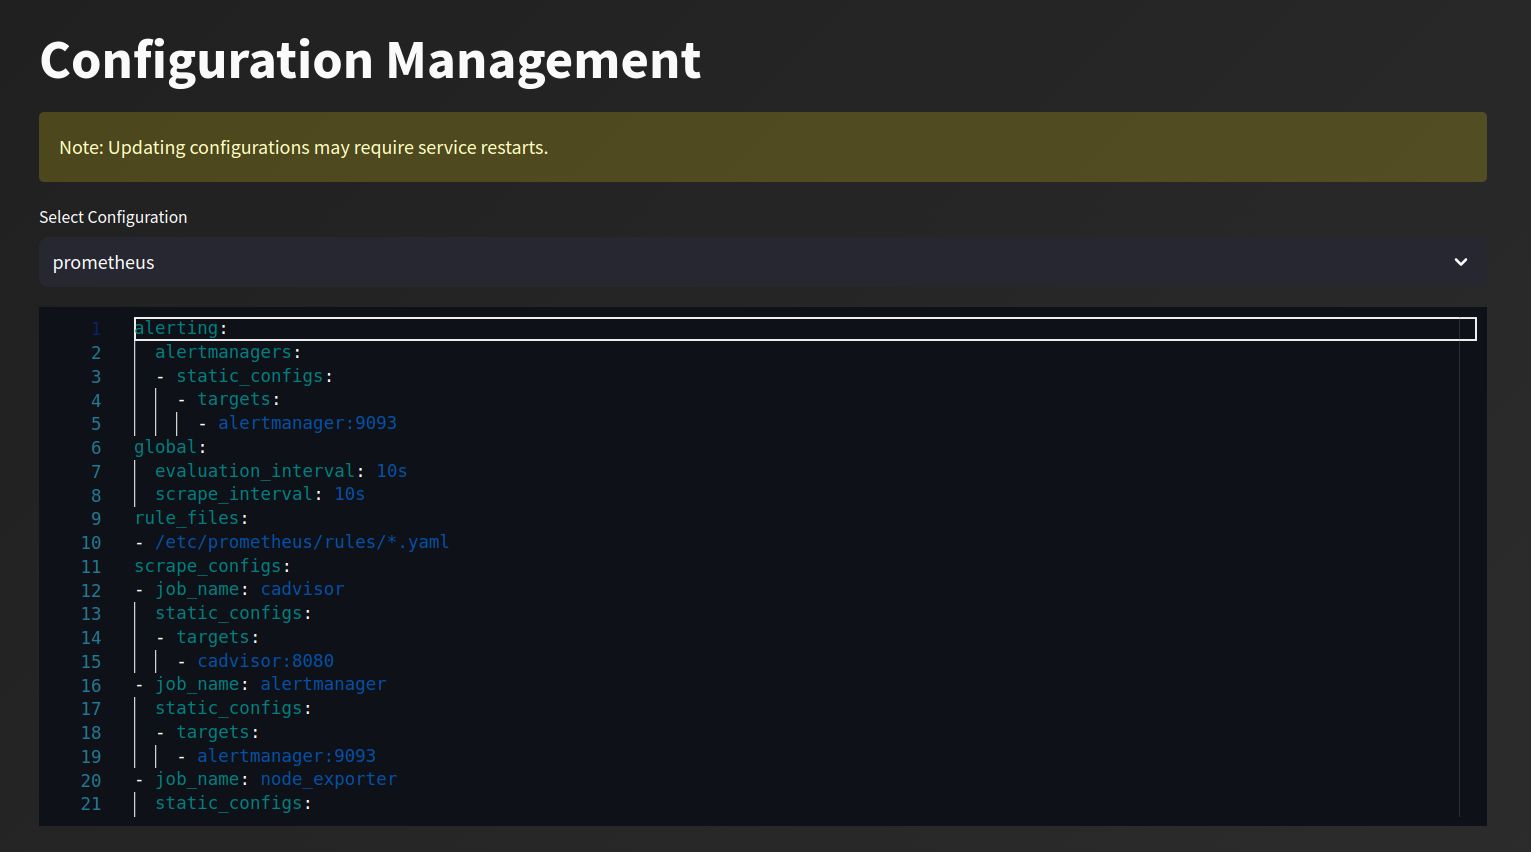
Figure 4 - LogWatcher configuration management illustrated -
Configuration Management
Configuring any system requires depth knowledge in the field to be successful. For that reason, I created an interface to easily manipulate the configuration files from the user friendly interface.
In configuring docker container, there is a slight problem. The problem is that you need to restart the container to make the changes take effect. Each container in the monitoring network interface is observed and can be visible through the interface.
If you create another container in the same network as 'monitoring', the container will be detected by the system and automatically start fetching metrics from the container.

Figure 5 - LogWatcher real-time log view center illustrated -
Real-time Logs
This one is a little different. Normally, there is no need to set up Loki & Promtail stack to gather logs, simply using python docker module gives the exactly same solution.
However, in docker way the logs are not processable by Prometheus, thus leading unprocessed read-only data which is waste of time for such a monitoring system.
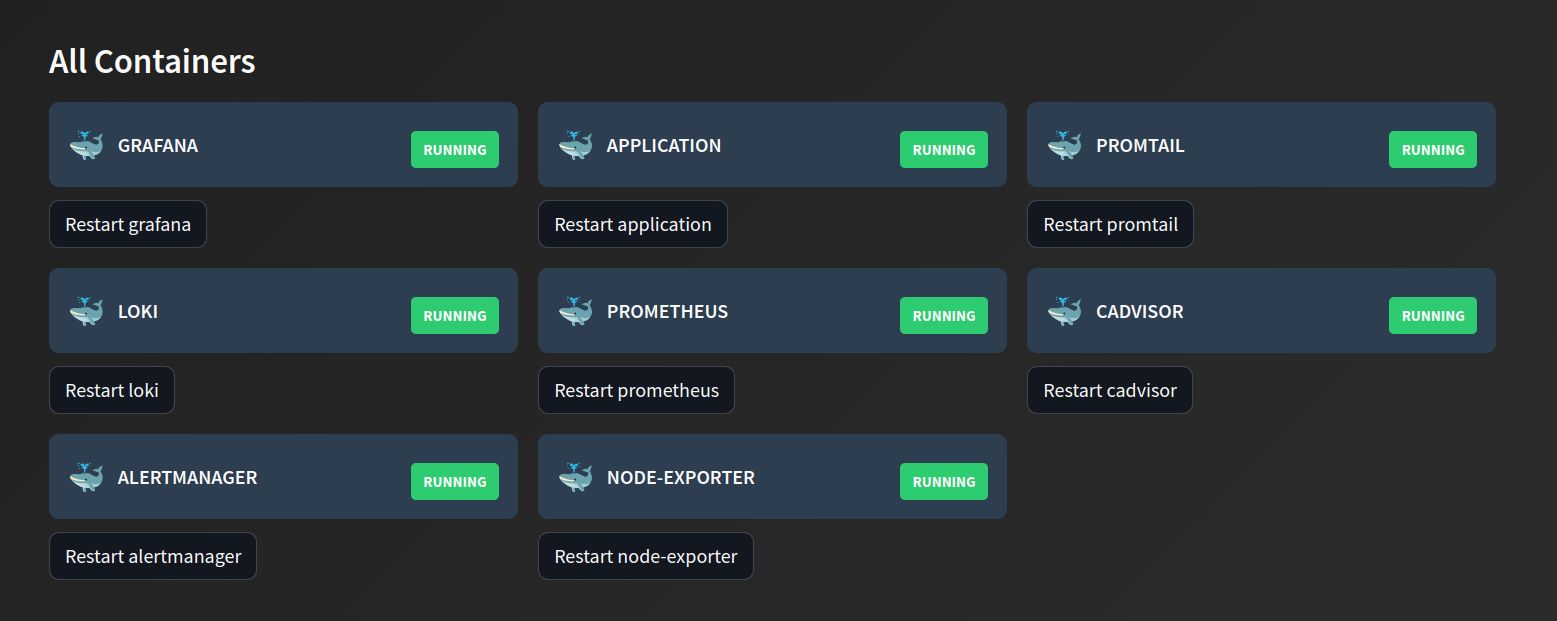
Figure 6 - LogWatcher container management center illustrated -
Full access from the dashboard to the docker containers and easy manipulation is enabled thanks to docker module.
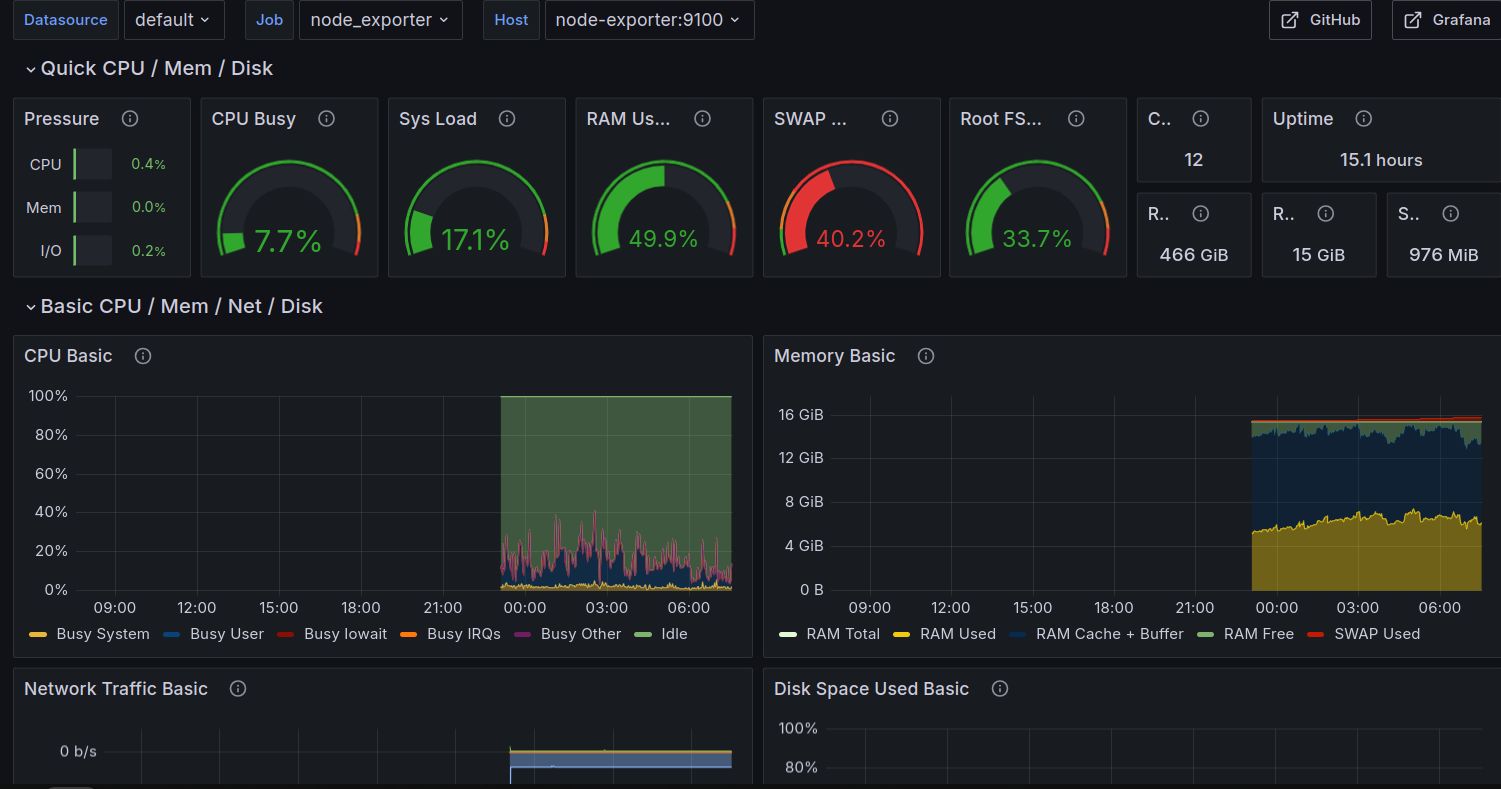
Figure 7 - Local system resource usage in Grafana -
This screenshot depicts pre-configured node exporter dashboard in Grafana. The system uses JSON and YAML templates to configure the whole system. Especially in Grafana, there are a lot of ready dashboard styles avaliable at link.
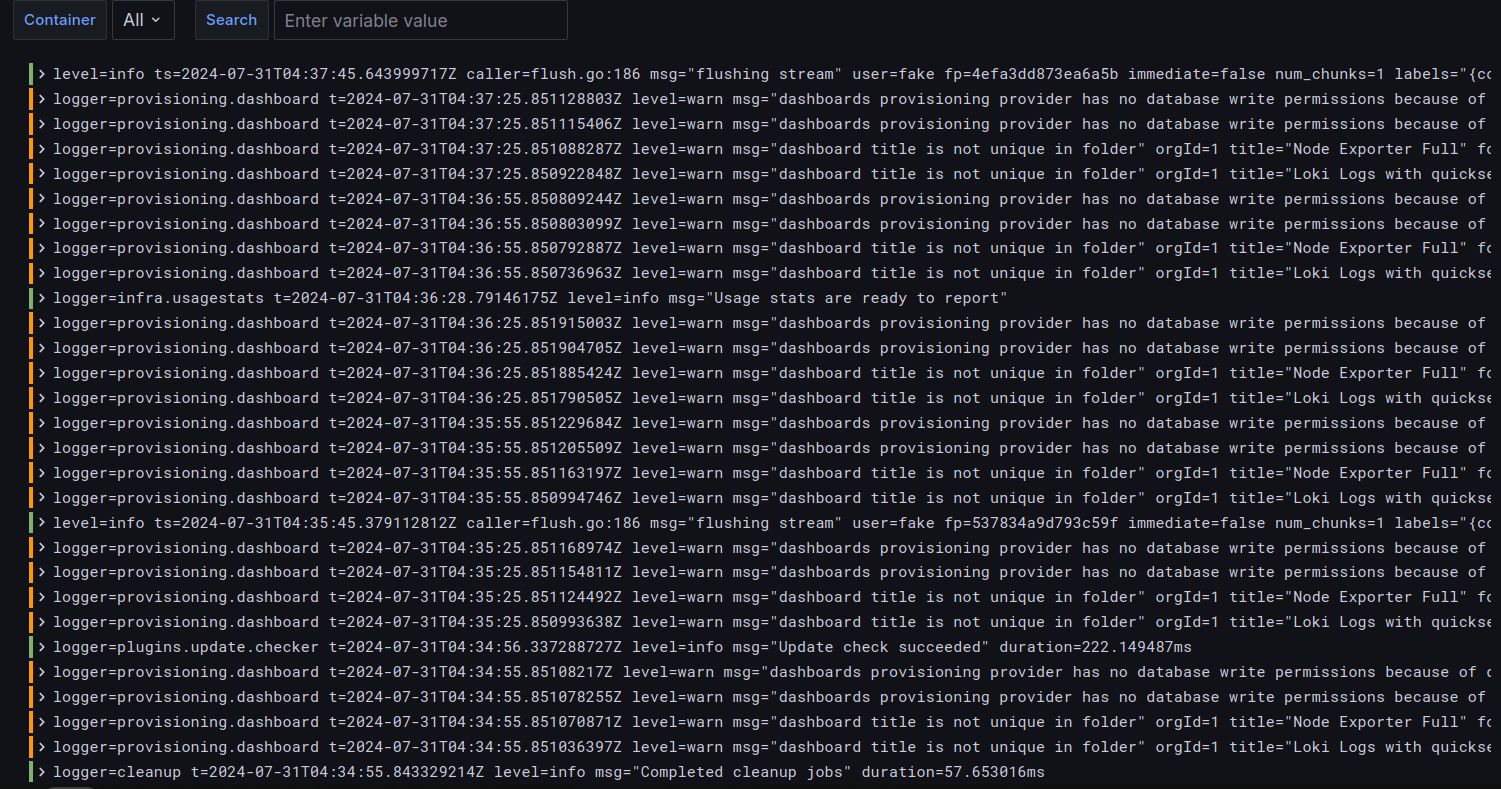
Figure 8 - Loki & Promptail log metrics in Grafana -
This picture showcases the log datas scraped from all containers in monitoring docker network interface. Each log is labeled and has priority, thus Prometheus and Grafana can take action according to the given priority.
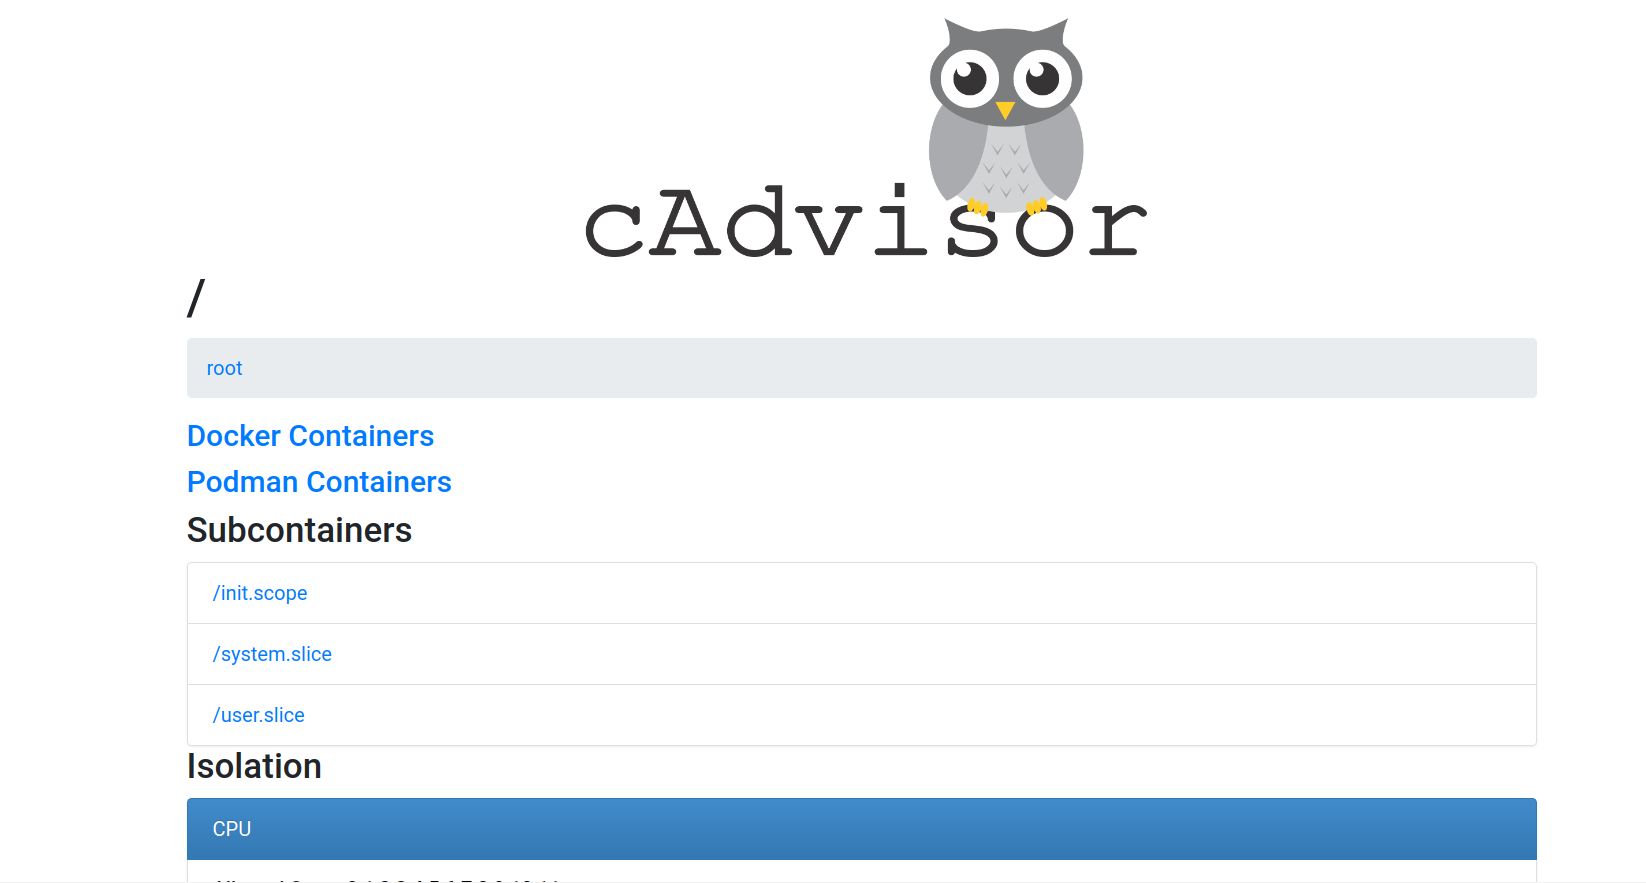
Figure 9 - Cadvisor interface showcase -
As the name suggests, this is cadvisor dashboard. You can basically reach any container resource metrics from this interface too.
Cadvisor gathers docker container information and sends them to Promethus as the Figure 2 depicts. Cadvisor will be avaliable at http://localhost:8080/containers/.
Conclusion
Doing such a project was really self-teaching, and would really see what people reacts to the project. If project gets attention, next features definitely will be integration with cloud platforms and ease of integration with any tool.
Thank you for exploring LogWatcher with me, and I look forward to seeing how this tool evolves with the community’s input.
Best regards Atakan G.
If you like such projects and talks, I highly recommend subscribing to the newsletter. It's free.
Resources
https://www.techtarget.com/searchnetworking/definition/loose-coupling
https://en.wikipedia.org/wiki/Microservices
https://prometheus.io/docs/instrumenting/exporters/
https://en.wikipedia.org/wiki/Configuration_management
https://streamlit.io/
https://www.cloudflare.com/learning/ssl/what-is-https/
https://docs.docker.com/reference/cli/docker/image/ls/
https://budibase.com/internal-tools/
https://aws.amazon.com/what-is/cli/
https://en.wikipedia.org/wiki/Graphical_user_interface
https://www.techtarget.com/searchitoperations/definition/Docker-image
https://grafana.com/grafana/dashboards/
